Matt Wolfinger is a data reporter and graduate of Northeastern University's journalism master's program. While there, he mastered multiple coding languages and libraries to become a fierce competitor in the industry. At Denver Business Journal, Matt was the newsroom's sole data reporter and covered the cannabis beat. In Boston, they continue to conduct on-the-ground reporting at protests. His writing has appeared in Denver Business Journal, ConsumerAffairs, Working Mass, The Scope, and more.
Starbucks Union March - The Scope
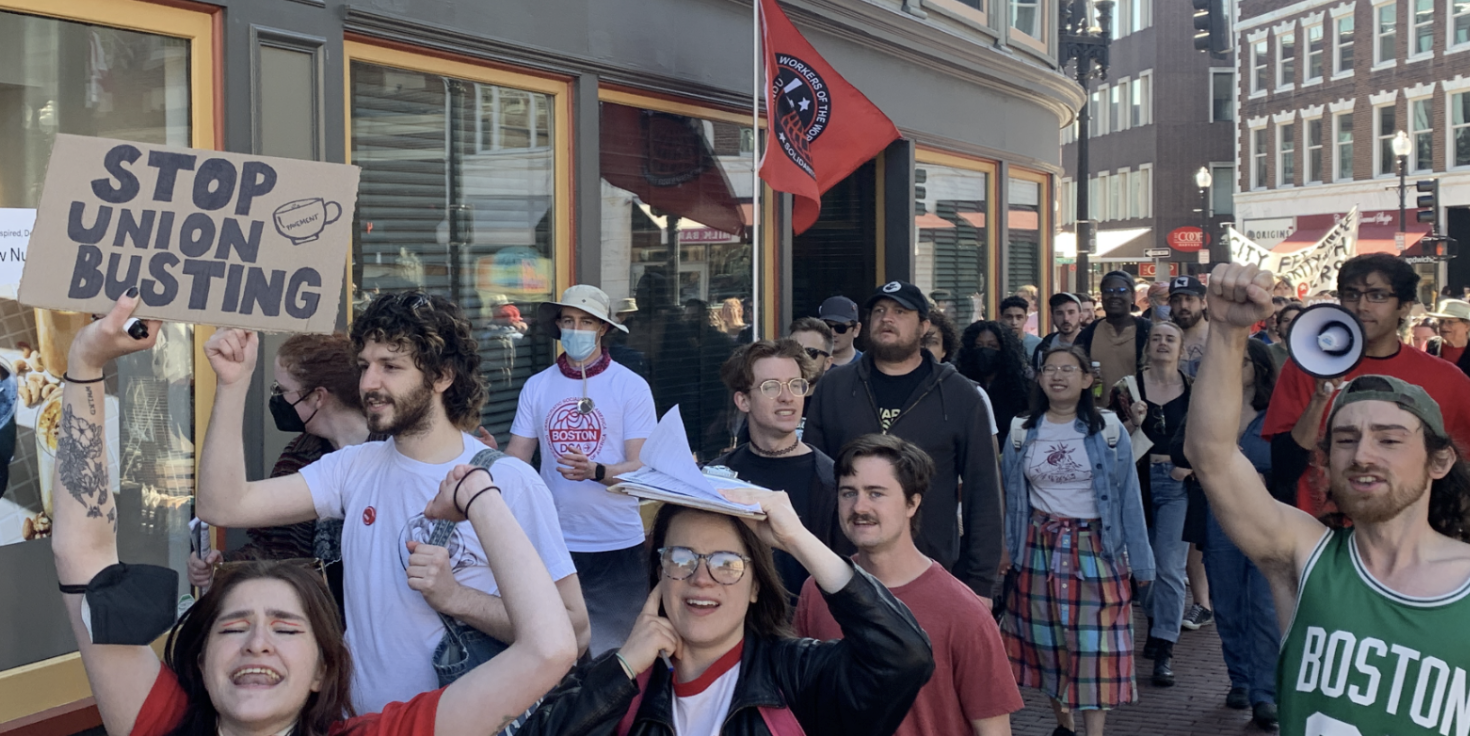
Reporting on a march organized by Boston-based Starbucks and independent cafe workers fighting back against union-busting. Explores the nationwide labor movement that took place across Starbucks stores in 2022. Best of SNO award winner.
The Rising Cost of Living - DBJ

Denver Business Journal reporting on data from the Council of Community and Economic Research's Cost of Living Index. Compares the rise in Denver's cost of living to the national average. Filterable charts made in Infogram and Datawrapper.
Boston Cop Track - Storybench
An in-depth breakdown of the process of assembling my master's thesis project at Northeastern University, a searchable interface of Boston police misconduct data.
HTML/CSS/JS, Illustrator, Excel
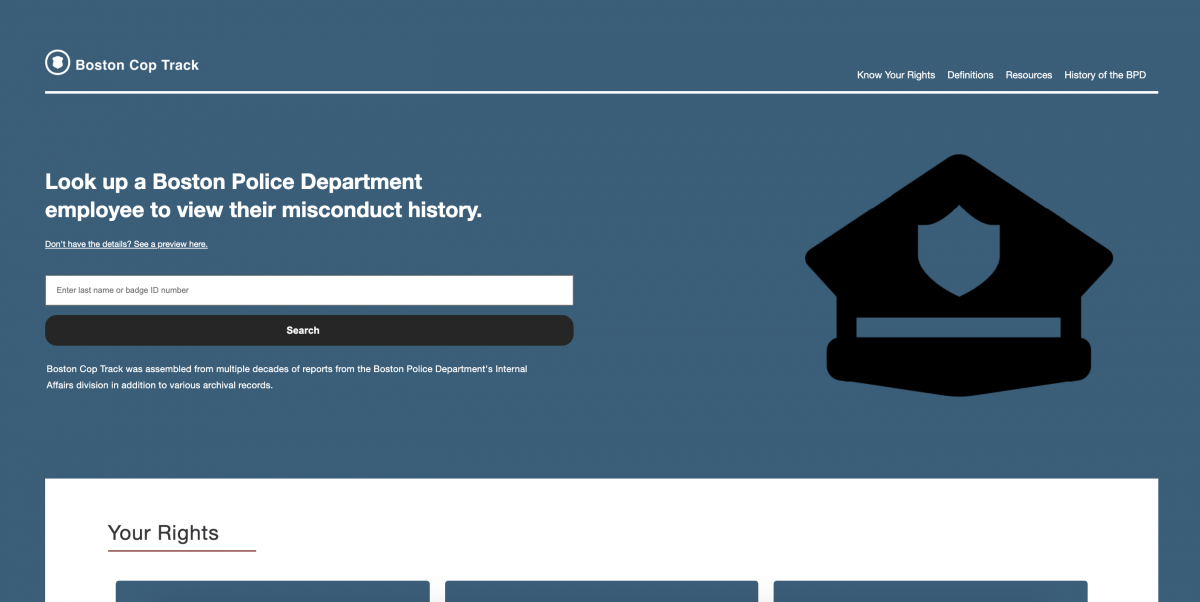
Boston Cop Track

My Northeastern University master's thesis project. A searchable interface containing two decades of Boston Police misconduct data. Look up a BPD officer by their name or badge ID number to see their entire recorded history of misconduct allegations.
HTML/CSS/JS, Illustrator, Excel
Philly Demolitions Project
Final project for my Design Mapping class at Northeastern. A StoryMaps project with ArcGIS online maps, documenting the trend of historic site demolitions in Philadelphia. Utilizes data from OpenDataPhilly and includes a Datawrapper graph.
Pitchfork Album Analysis

Project constructed for my Visualization Technologies course at Northeastern analyzing Pitchfork scores for various albums. Analysis and data vis completed using RStudio. Filterable chart built with D3.js.
HTML/CSS/JS, RStudio, Excel
Data Vis
For Denver Business Journal I analyzed data from the Council of Community and Economic Research's Cost of Living Index, which weighs multiple factors (the cost of rent, groceries and gas) to calculate a percentage increase in the average cost of living for every city in the United States. I discovered that Denver's rate of inflation between 2019 and 2022 was higher than the national average, then created a filterable bar chart to visualize my findings. The chart displays the top 5 urban areas in Colorado that saw the largest percentage increase in the average costs of groceries, gas and rent.
Choropleth Map
To complement my reporting on U.S. Postal Service change-of-address data, I constructed a choropleth map to visualize my findings. By subtracting the number of businesses that filed change-of-address requests out of each ZIP code from those moving into it, I calculated the net gains and losses of businesses between 2019 and 2022 for each area.
Using census ZIP code tabulation data, each area's net loss/increase value was paired with its respective ZIP code and assigned a color value, with lighter colors signifying a larger net loss and vice-versa.
Downtown Denver saw the largest net loss of registered businesses, while the ZIP code with the largest net increase housed the Denver Tech Center and the newly-renovated Belleview commuter rail station.
Published work
Denver Business Journal
Colorado CEOs earned 164 times more than their workers last year
Medical marijuana sales reach record low in Colorado
How bad is inflation in Denver? New data sheds light on the rising cost of living
More than 1,000 businesses left downtown Denver since 2019, according to the USPS
Want to start a side hustle? This study says Denver is a pretty good spot to do it
Colorado researchers received record-breaking NIH funding for second year in a row
Every Fortune 1000 company in Colorado had at least one woman on their board last year
Top Front Range revenue-earners share their secrets to success
Colorado hospitals rank well despite staff shortages and burnout
ConsumerAffairs
Want to move to a big city? Here are the cheapest places to live
Debt the halls: 65% of shoppers report financial stress leading up to the holidays
Migration trends report: Where are people moving in 2024?
Where do most car accidents happen in the U.S.?
Nearly half of renters say they've had to take on debt to pay rent. Which cities have it the worst?
These states spend the most on their roads. But are conditions really improving?
Colorado cities with the worst drivers
Storybench
Assembling a searchable interface of Boston police misconduct data
Working Mass
Cross the finish line, not the picket line - Newton runs 5k to support striking Starbucks baristas
The Scope
Boston Starbucks workers march with local cafes against union-busting
Workers hold rally in solidarity with grocery store union
Retirement Living
Rising Rents Are Pushing Out Seniors in These States