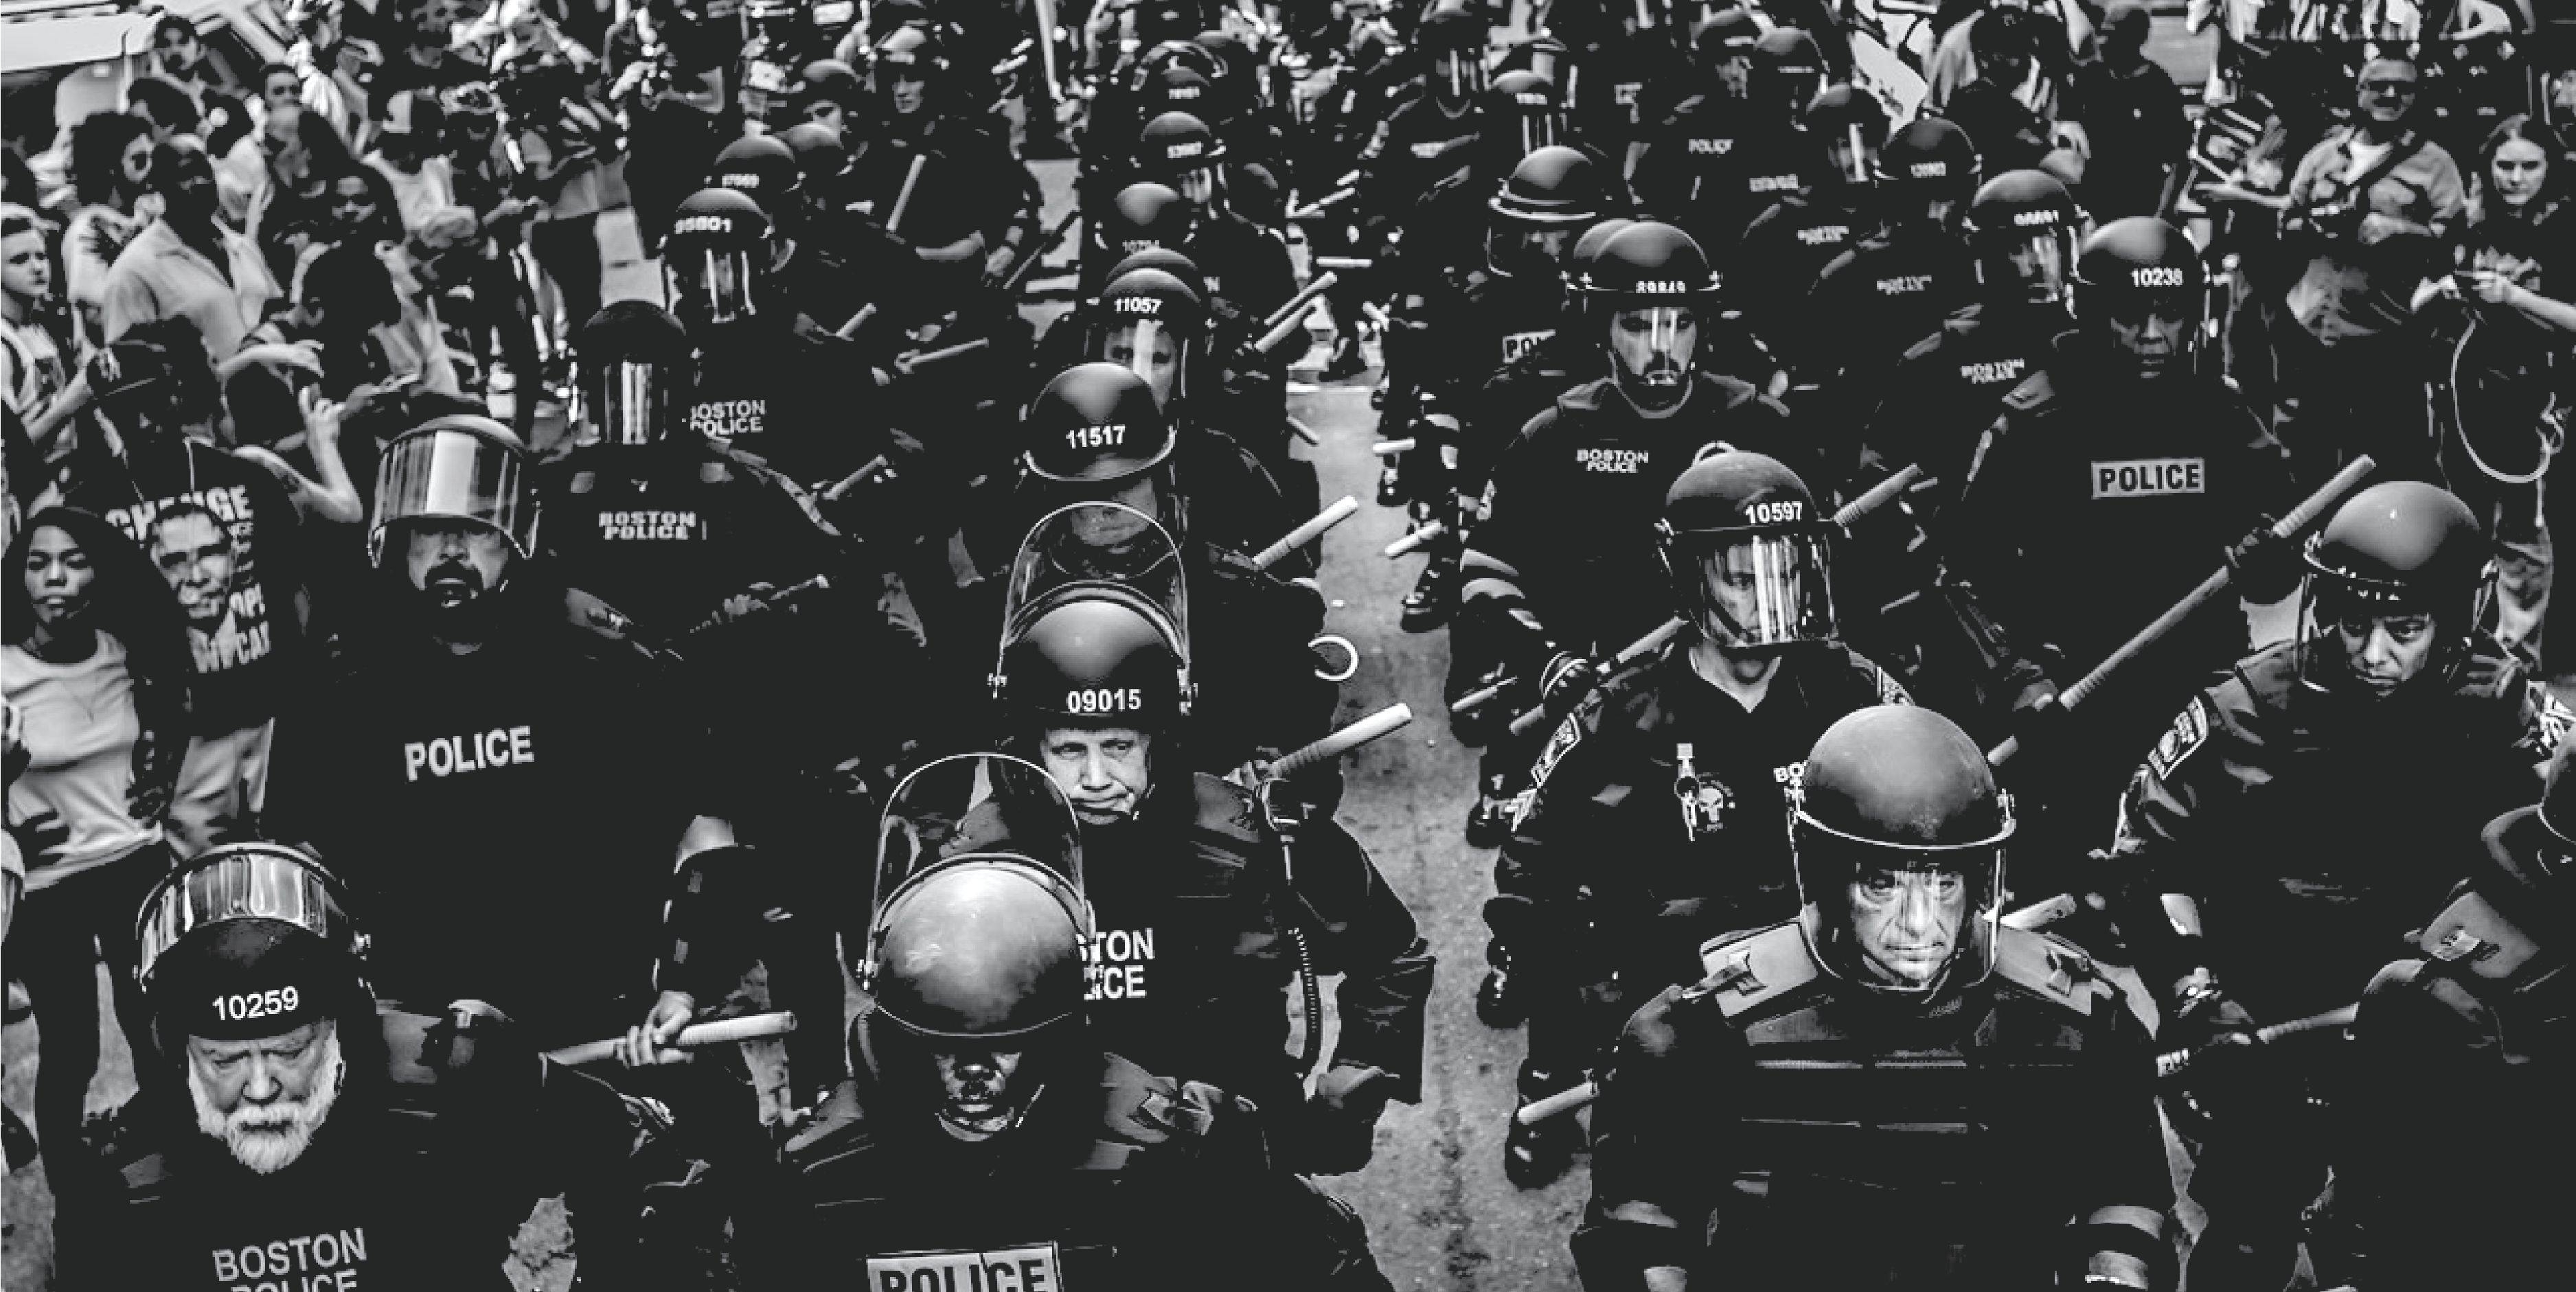
Below you'll find a handful of projects I created while enrolled at Northeastern University. While pursuing my master's degree in Journalism, I perfected my knowledge of HTML, CSS, and JavaScript libraries to create projects for my courses I could personally feel proud of — all through the lens of data and extensive analysis.

Boston Cop Track

My Northeastern University master's thesis project. A searchable interface containing two decades of Boston Police misconduct data. Look up a BPD officer by their name or badge ID number to see their entire cataloged history of misconduct allegations.

HTML/CSS/JS, Illustrator, Excel

Philly Demolitions Project

Final project for my Design Mapping class at Northeastern. A StoryMaps project containing multiple maps built using ArcGIS online, documenting the disturbing trend of demolitions of historic sites within the city of Philadelphia — utilizes data sourced from OpenDataPhilly and includes a data vis graph constructed with Datawrapper.

ArcGIS Online, StoryMaps, Datawrapper

Pitchfork Album Analysis

A combination of two projects constructed for my Visualization Technologies course at Northeastern. Analysis and data vis constructed using RStudio, and presentation itself constructed with HTML and CSS. Interactive data vis chart with filters built using the D3 JavaScript library. Click the David Bowie icon to view the next iteration of that project — focused on Pitchfork's reviews of David Bowie albums.

HTML/CSS/JS, RStudio, Excel